
Web Dashboards for IoT Data Visualization in Smart Cities
As cities continue to evolve into smarter, more connected environments, the role of IoT data visualization becomes increasingly important. From traffic management and energy usage to air quality and waste disposal, smart cities rely on a complex web of Internet of Things (IoT) devices. These devices generate massive amounts of data that need to be organized, analyzed, and understood. This is where web dashboards come in — powerful tools that make sense of complex IoT data streams, enabling real-time decision-making and efficient city management.This blog is a part of our Service Web designing.
Table of Contents
What Are Web Dashboards
A web dashboard is an online interface that visually presents real-time data from various sources using charts, graphs, maps, and widgets. For smart cities, these dashboards play a crucial role in IoT data visualization by pulling information from thousands of IoT sensors and devices spread across urban infrastructure. Typically accessible through web browsers, web dashboards are designed to offer intuitive, customizable views of metrics and KPIs relevant to city planners, government officials, and even citizens.
IoT data visualization through web dashboards is not just about displaying raw data — it’s about converting it into actionable insights. These dashboards can showcase alerts when air quality drops, monitor energy consumption trends, or display the current status of traffic congestion. Ultimately, they empower decision-makers to respond promptly and effectively, enhancing operational efficiency and urban living.
IoT Data Visualization in Smart Cities
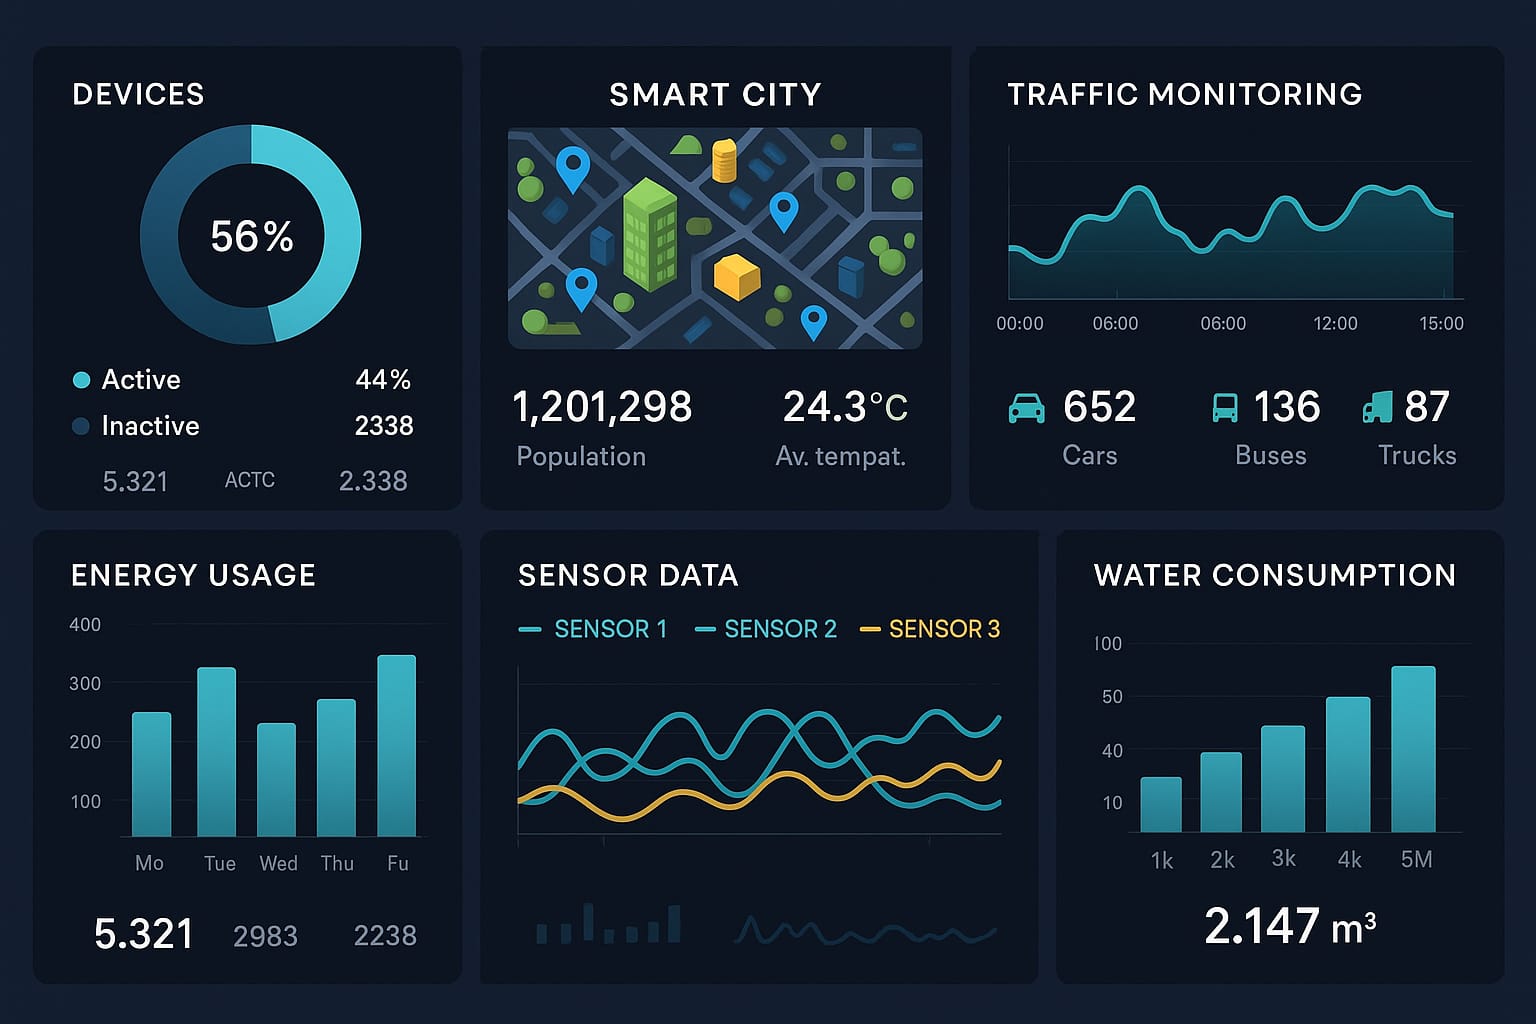
IoT data visualization refers to the representation of information collected from IoT devices in a graphical and interactive format. In a smart city context, this can include data from sensors monitoring:
- Traffic flow and congestion
- Water and energy usage
- Air and noise pollution
- Smart lighting systems
- Waste management bins
- Parking availability
For example, a traffic management dashboard can display live maps showing congestion hotspots and suggest alternate routes. Similarly, a dashboard for environmental monitoring can provide real-time updates on air quality indices across different city zones.
Without proper visualization, this data would remain buried in spreadsheets and logs, making it difficult to act on. Visualization allows for pattern recognition, anomaly detection, and trend forecasting — all vital for efficient urban management.
Importance of IoT Data Visualization and Web Dashboards
The importance of combining IoT data visualization with web dashboards in smart cities cannot be overstated. Here’s why:
- Real-Time Monitoring and Alerts
Web dashboards allow city administrators to monitor conditions in real time. If there’s a water leak, a sudden traffic jam, or a spike in pollution, dashboards can immediately alert the right department for quick intervention. - Efficient Resource Allocation
With a clear visual representation of where resources are most needed — be it electricity, water, or emergency services — city planners can allocate them more effectively. - Enhanced Transparency and Public Engagement
Some smart cities provide public access to selected dashboard views. This builds trust by keeping citizens informed about environmental quality, traffic, or safety concerns. - Better Decision Making
When decision-makers have access to intuitive visual data, they can plan for long-term improvements based on actual usage trends and not assumptions. - Scalability
Web dashboards are scalable. As cities grow and add more IoT devices, dashboards can be configured to visualize additional datasets without overhauling the system.
Benefits of IoT Data Visualization in Smart Cities
Let’s take a closer look at the specific benefits of implementing IoT data visualization through web dashboards in urban environments:
Predictive Maintenance
Smart cities use IoT data to forecast infrastructure failures before they occur. A dashboard might display vibration data from a bridge, alerting engineers when values deviate from the norm. This proactive approach reduces repair costs and prevents accidents.
Improved Traffic Flow
Dashboards visualizing vehicle and pedestrian movement help reduce congestion. Traffic signals can be automatically adjusted based on real-time data, improving commuter experience and lowering emissions.
Environmental Protection
Visualizing air quality, water levels, and waste data enables cities to quickly address pollution sources. This fosters healthier living environments and supports sustainable development goals.
Energy Efficiency
IoT-powered dashboards help track electricity usage in public buildings or street lights, allowing cities to implement energy-saving measures like dimming lights during off-peak hours.
Crime Prevention and Safety
Smart surveillance systems connected to dashboards can analyze crowd behavior or detect unusual activities. This information can then be shared with law enforcement for a faster response.
Key Features of Effective Web Dashboards
A well-designed IoT data visualization dashboard includes the following features:
- Customizable Widgets: Users can tailor their dashboard views to focus on relevant metrics.
- Geospatial Mapping: Visual data overlaid on maps helps identify trends in specific locations.
- Real-Time Updates: Instant data refresh ensures up-to-date decision-making.
- User-Friendly Interface: A clean, intuitive layout ensures usability across all skill levels.
- Integration Capabilities: The ability to connect with APIs, cloud platforms, and legacy systems.
Real-World Example: Barcelona’s Smart City Dashboard
Barcelona is one of the leading smart cities globally, and its IoT data visualization system is a benchmark. The city’s web dashboards manage everything from street lighting and water management to waste collection and public transport. By integrating sensor data with visualization tools, city officials have significantly improved operational efficiency and reduced public spending.
Future Trends in IoT Data Visualization for Smart Cities
As smart cities evolve, the future of IoT data dashboards will involve:
- AI-Powered Visualizations: Artificial Intelligence will automate insights and detect patterns faster.
- Augmented Reality Interfaces: Future dashboards may offer AR overlays for field workers.
- Citizen Feedback Integration: Dashboards could soon combine sensor data with public input for deeper insights.
- Decentralized Data Management: Blockchain and edge computing will enhance data security and accessibility.
Challenges in Implementing IoT Data Visualization in Smart Cities
While the benefits of IoT data visualization are compelling, smart cities also face several challenges in implementing and scaling these solutions:
Data Overload
With thousands of IoT devices generating continuous data, cities often struggle with filtering valuable insights from noise. Without the right data management strategies, dashboards can become cluttered and less useful.
Interoperability Issues
Different IoT devices and platforms may use varying communication protocols and data formats. Integrating these into a single dashboard that provides a unified view is a technical hurdle.
Privacy and Security Concerns
Real-time data — especially from surveillance, transport, or health-related sensors — can be sensitive. Ensuring that IoT dashboards are secure and comply with data privacy regulations is essential.
Infrastructure and Connectivity
Stable internet and data infrastructure are necessary for dashboards to work in real time. In some regions, this is still a limiting factor.
Training and Usability
City employees and decision-makers may need training to interpret dashboard data accurately and make informed decisions. A dashboard is only as useful as the user’s ability to understand and act on it.
In the era of urban innovation, IoT data visualization through web dashboards is not just a technical upgrade — it’s a necessity. These tools bridge the gap between data collection and actionable insights, empowering cities to become smarter, safer, and more sustainable. As more municipalities adopt IoT technologies, investing in user-friendly and scalable web dashboards will be key to unlocking the full potential of smart city infrastructure.